One of the most popular posts on this site, as you can see from the sidebar, is my post from May 2012 about the
average rents in each London borough. Admittedly a lot of traffic comes from google sending people here looking for a map of London boroughs, but anyhoo, its still an interesting topic.
The other day, on twitter, Sarah retweeted comment from
Emma Jackson about how rents in London were crazy and average rents in Newham had shot up 39% the last year. Alas this information came from a press release a year ago, but it got me wondering about what rents were like now that the Olympics is firmly in the past, and how rents have changed from last year.
So I dug out my old spreadsheet, went through the
rightmove.com property website, and counted up how many two bedroom flats there were in each London borough at each price point, weaved some Excel magic and well here's a list of average rents last year and this year, and their percentage change.
Borough
|
10 May 2012
|
08 May 2013
|
Change
|
| Merton |
£ 1,581.29 |
£ 1,766.93 |
111.74% |
| Redbridge |
£ 1,080.05 |
£ 1,193.77 |
110.53% |
| Hillington |
£ 1,112.92 |
£ 1,201.08 |
107.92% |
| Bexley |
£ 858.70 |
£ 914.26 |
106.47% |
| Enfield |
£ 1,135.41 |
£ 1,201.74 |
105.84% |
| Croydon |
£ 1,014.19 |
£ 1,063.27 |
104.84% |
| Westminster |
£ 2,796.06 |
£ 2,918.95 |
104.40% |
| Greenwich |
£ 1,332.97 |
£ 1,387.40 |
104.08% |
| Waltham Forest |
£ 1,092.00 |
£ 1,134.49 |
103.89% |
| Barnet |
£ 1,419.80 |
£ 1,465.49 |
103.22% |
| Southwark |
£ 1,840.94 |
£ 1,899.17 |
103.16% |
| Barking |
£ 967.14 |
£ 994.93 |
102.87% |
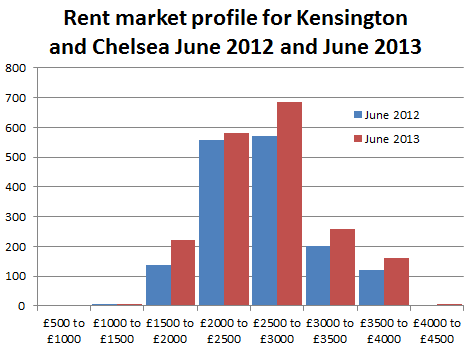
| Kensington and Chelsea |
£ 2,856.73 |
£ 2,907.43 |
101.77% |
| Ealing |
£ 1,578.19 |
£ 1,606.16 |
101.77% |
| Sutton |
£ 1,029.41 |
£ 1,046.86 |
101.70% |
| Hounslow |
£ 1,785.18 |
£ 1,808.97 |
101.33% |
| Hackney |
£ 1,876.80 |
£ 1,898.31 |
101.15% |
| Lewisham |
£ 1,224.56 |
£ 1,236.24 |
100.95% |
| Camden |
£ 2,359.67 |
£ 2,375.90 |
100.69% |
| Kingston Upon Thames |
£ 1,402.73 |
£ 1,412.13 |
100.67% |
| Brent |
£ 1,483.54 |
£ 1,491.47 |
100.53% |
| Harrow |
£ 1,248.56 |
£ 1,253.38 |
100.39% |
| Bromley |
£ 1,127.81 |
£ 1,131.87 |
100.36% |
| Havering |
£ 967.49 |
£ 963.83 |
99.62% |
| Islington |
£ 2,217.82 |
£ 2,185.26 |
98.53% |
| Lambeth |
£ 1,745.46 |
£ 1,708.09 |
97.86% |
| Haringey |
£ 1,432.51 |
£ 1,401.14 |
97.81% |
| Richmond |
£ 1,927.33 |
£ 1,878.68 |
97.48% |
| Tower Hamlets |
£ 2,066.11 |
£ 2,011.83 |
97.37% |
| Newham |
£ 1,410.63 |
£ 1,373.49 |
97.37% |
| Wandsworth |
£ 1,844.08 |
£ 1,756.62 |
95.26% |
| Hammersmith and Fulham |
£ 2,102.78 |
£ 1,993.76 |
94.82% |
| City of London |
£ 2,817.34 |
£ 2,474.32 |
87.82% |
Its perhaps more useful to see this on a map,
So average rents for two bedroom properties have risen in most of the suburban boroughs, broadly in line with inflation, and average rents for two bedroom properties nearer the centre of town have fallen, but its a mixed bag. One wonders why.
At this point I'd like to announce a new statistical product, GilMove Index of Average London Rent levels for two bedroom properties. This is basically the percentage the market has moved for the whole of London from a benchmark set in May 2012.
The GilMove Index for May 2013 is 103.31
That is, based on data scraped from RightMove.com for the whole of London average rents have risen by 3.31% With inflation in mind that's broadly to be expected.
Right now, RightMove.com lists about 29,500 properties in London, that's up 6,300 from a year ago, or 27.3%. Well done London. If there's a shortage of houses, the problem is being addressed.
Westminster seems to have over a thousand more properties on the market since last year, from 2,200 in May 2012 to 3,500 in May 2013. Is it because they evicted all the social tenants and put the properties in the private sector? Seems unlikely that that would account for so many properties, a few hundred I could understand.
Other boroughs with huge increases of two bed properties on the market are Kensington and Chelsea with around 800 more, Camden with around 600 more and Richmond with 500 more.
So, could it be that in areas where more properties have come onto the market since last year, the average rents have changed the most. That there is some kind of correlation between these two things? Well, no. I ran the numbers and is absolutely no correlation between the two variables.
The only correlation I can see is that boroughs with very few two bedroom properties on the market have the lowest average rents, and boroughs with the most properties on the market have the highest rents.
I guess its a relatively free market, with supply and demand acting as they do. Less desirably places are cheap and with not much going down, desirably places are in demand and have lots of properties available.
Anywho, it was all pretty settled, until on Friday there was a tweet from a chap called
Murray who was tweeting a link to an article in the Evening Standard about how in order to afford to rent a one bedroom property in London, you'd need an annual income of £38,000, and average income in the UK is £26,000.
Alarm bells in my head started ringing, firstly, its based on a government diktat that you ought to only spend a third of your income on rent, which is fine if you acknowledge it, but not really relevant to the way people live their lives. Some people will want to spend a greater proportion on their earnings on a more desirable location, some people may be willing to live in a cheap place to allocate their resources elsewhere. People are free to spend their money in many different ways. It riles me when the government says I can't afford something when clearly I'm in a better position to decide.
Secondly, it seems a bit rum to compare national wages with regional rents, London prices are almost like being in a different country to the rest of the UK. A more appropriate comparison would be London rents to the average wage in London, a bit of googling had the London mean wage being £40,000, so no problem renting an average one bedroom property.
Of course its arguable that you should use the median wage rather than the mean which is hellish skewed in London. But then the property market is similarly skewed, so you should use the median rent for a valid comparison.
Look, mean average one bedroom rents in
Motherwell are £348 per month, you'd need to earn about half the average income to afford one, you could afford one if you had a minimum wage job without much of a struggle.
Anywho, I quickly clicked through Murray's link to find the
Evening Standard with a rather short sensational article about London rents and wages.
The figure follows a Standard report last month that revealed rents in the capital are rising eight times faster than wages.
Wait... what. I've already established that rents in various London boroughs are all over the place, some rising, some falling and generally the rise is in line with inflation, 3.31%. But even then, we're getting toward the margin of error to say that average national wages are only rising at 0.41%. Its a bit of a stretch.
It seems the latest Evening Standard article just reproduces a press release from a website called
Rentonomy which is...
an easy-to-use site that looks at London in a totally new way and gives you all the tools you need to find the right area for you
Awesomeness!
However I question Rentonomy's director of research, David Butler's use of national average wages for regional rents. Its inappropriate, sensationalistic, and crap.
The original
Evening Standard article from April uses rent data from a different source lettings agency network
LSL Property Services. They quote
Last month the average monthly rent in London stood at £1106, a rise of 7.9 per cent in a year and the highest level ever recorded.
I don't have my own data for rent levels in April 2013 or April 2012, so I can't vouch for its accuracy, but LSL's figures seem way different from rent levels from my figures from May to May. Maybe that's the figure for all properties, regardless of number of bedrooms. *shrug*
David Newnes, director of LSL Property Services, owners of estate agents Reeds Rains and Your Move, seems a bit disingenuous when he says:-
“Rents in London are red-hot. With only modest improvements in the UK’s housing supply, rents will keep being forced upwards.”
As I have previously established, London rents are nothing special compared to a year ago, more stable than in the Olympic year, were rents in London white-hot in 2012? Also, the London housing supply seems to have increased in several boroughs since last year. Up 27% overall, how is that 'modest', I reckon 'dramatic' would be a better word.
Maybe, it's all happened in the last month, and he was right back in April.
References
Source data on google spreadsheet here
Scraped from the RightMove property website
 Using my bare ninja skillz I wrote a script in perl that processed the raw gps data from a txt file and then generated a png image file from scratch.


